
How to build a fiber distance simulator.
- published
- 2026-11-17
- read_time
- 9 min
- author
- Wave2Wave Engineering Team
- reviewer
- Mark Crandon, CEO
How to put 5, 10 and 20 km of real fiber in a rack: the design choices, the loss to expect on each path, and the test reports to ask for.
A fiber distance simulator is spooled single-mode fiber in a rack-mounted enclosure, with connectors on the front panel. It is also called a fiber spool box, fiber delay line or fiber optic test spool. It lets a lab test optics, links and protocols over real distance without a field run. This guide works through a common request, many full-duplex links at 5, 10 and 20 km, and shows how to lay it out, what loss to expect, and how to check the result.
- Give each link its own 5 km path, and a pair of 10 km spools that serves both 10 km and 20 km
- For 20 km, join the two 10 km spools with a short patch cord on the front panel
- Expect about 2.0, 3.7 and 7.4 dB at 1310 nm, and 1.3, 2.3 and 4.6 dB at 1550 nm, for 5, 10 and 20 km
- Fifteen links fit in four 4U chassis, 16U in total
- Ask for insertion and return loss, two-way OTDR traces, end-face images and measured length for every path
01Why a distance simulator uses real fiber
An optical attenuator copies the loss of a long link, but not its length. A spool of real fiber also adds the delay and chromatic dispersion of the distance, and reflects light back the way a field link does. That matters when you test:
- Optics rated for 10 km, 20 km or more, at the distance on their label
- Protocols with timers or credit limits, such as Fibre Channel over distance, replication and clock sync
- Dispersion and signal quality on 1550 nm and DWDM optics
- OTDRs, monitoring systems and fault-finding procedures, against a known length
| Distance | One-way delay | Chromatic dispersion at 1550 nm, up to |
|---|---|---|
| 5 km | about 25 µs | 90 ps/nm |
| 10 km | about 49 µs | 180 ps/nm |
| 20 km | about 98 µs | 360 ps/nm |
Delay uses about 4.9 µs per km, the speed of light in standard single-mode fiber. Dispersion uses the spool fiber's limit of 18 ps/(nm·km) at 1550 nm. For a pure receiver sensitivity test, an attenuator is cheaper and smaller.
02What a fiber distance simulator request asks for
Most lab requests for a distance simulator look like this one, and every line changes the design or the documents that ship with it.
| Requirement | What it means for the design |
|---|---|
| 15 simultaneous full-duplex links | Each link is a transmit fiber and a receive fiber, so every path is a duplex pair |
| 5, 10 and 20 km test paths | Decides how many spools each link needs and how distance is changed |
| OS2 single-mode, Corning SMF-28e+ or SMF-28 Ultra or equivalent | Sets the attenuation per km and the dispersion used in the loss budget |
| Duplex LC/UPC interfaces | Front-panel connectors that match the optics; UPC, not APC |
| Passive paths, no amplifiers or attenuators | Loss comes only from fiber and connections, so the budget is simple to predict |
| Rack-mounted enclosure | Spools in chassis, with the front panel as the only place anyone patches |
| Factory insertion and return loss | A measured value for every path, not a typical figure |
| Bidirectional OTDR at 1310 and 1550 nm | A trace in each direction, at both wavelengths, for every fiber |
| End-face inspection, measured length, attenuation report | Proof of clean connectors and the true length and loss of each spool |
03Four ways to build a distance simulator
| Design | Spools per link | Connections on the 20 km path | Distances at once per link | To change distance |
|---|---|---|---|---|
| A. A separate path for each distance | 5 + 10 + 20 km | 2 | All three | Move the test cords |
| B. 5 km path plus a 10 km pair (recommended) | 5 + 10 + 10 km | 4 | 5 km, plus 10 or 20 km | Add or remove a front jumper |
| C. Chain of 5 km spools | 4 x 5 km | 8 | One | Re-patch jumpers |
| D. Optical switch | Any | 2 plus the switch | One, chosen remotely | Software |
- A. A separate path for each distance. The lowest loss on every path and no jumpers, but the most fiber: 35 km of duplex path per link.
- B. A 5 km path plus a pair of 10 km spools. The 10 km spools serve both 10 km and 20 km, so each link needs 25 km of duplex path instead of 35. The cost is one jumper, and two connections, on the 20 km path.
- C. A chain of 5 km spools. The least fiber and 5 km steps up to 20 km, but 20 km passes through eight connections, about 0.6 dB more than design B and more end faces to keep clean.
- D. An optical switch. Selects the distance remotely, but it is active equipment that needs power and adds its own loss, so it does not meet a passive-only requirement.
Design B is the practical choice for most labs: every link gets 5 km at all times and 10 or 20 km on the other spools, with the fewest extra connections for the fiber used.
04A 15-link example
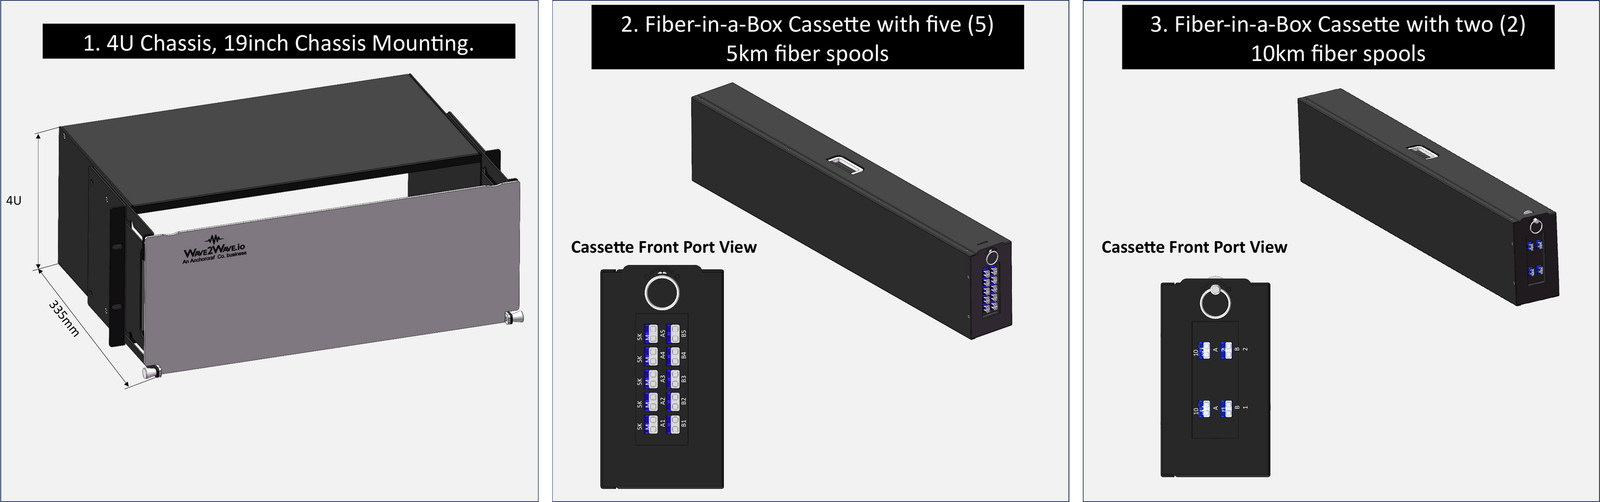
Fifteen links divide evenly into five-slot chassis. Using Fiber-in-a-Box 4U chassis, which hold five cassettes each:
| Part | Quantity | Serves |
|---|---|---|
| 4U chassis, 19 inch rack mount | 4 | 16U in total |
| Cassette with five 5 km duplex paths | 3 | The 5 km path on links 1 to 15 |
| Cassette with two 10 km duplex spools | 15 | The 10 km and 20 km paths, one cassette per link |
| Short duplex LC/UPC patch cords | 15 | The 20 km jumpers |
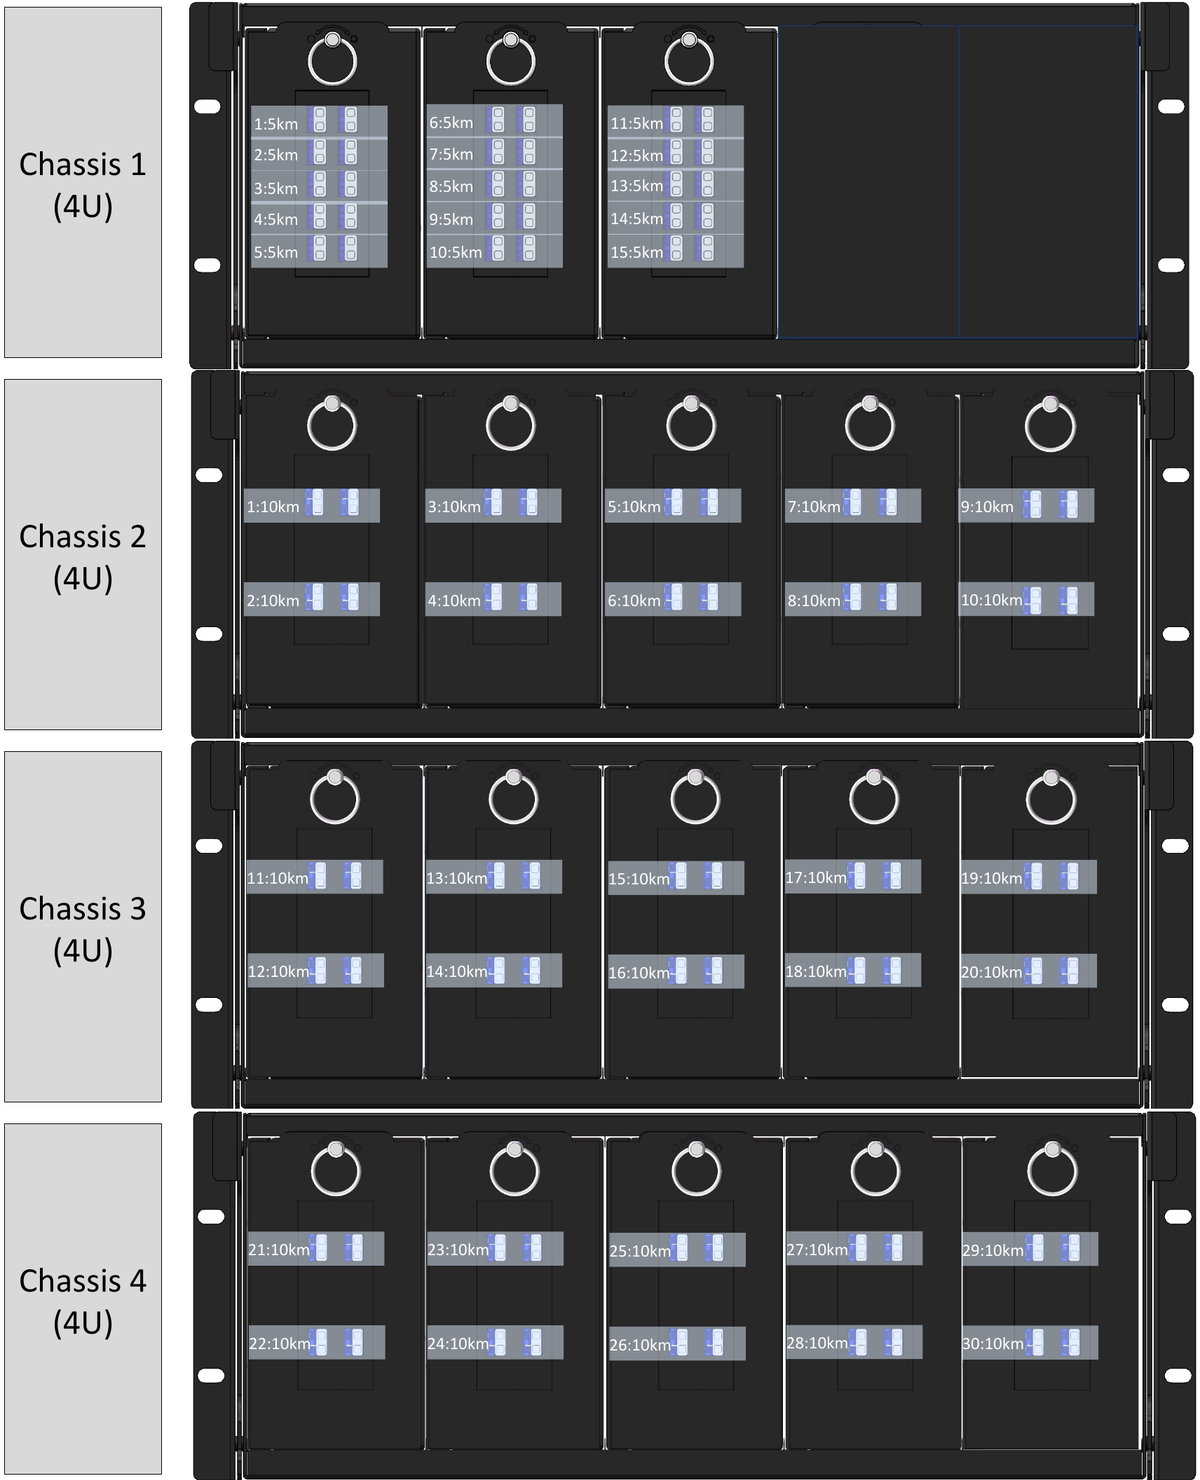
Chassis 1 holds all of the 5 km paths and keeps two slots open for spares or growth. Chassis 2, 3 and 4 hold the 10 km pairs for links 1 to 5, 6 to 10 and 11 to 15. On each 10 km cassette, spool 1 alone is the 10 km path; spool 1 joined to spool 2 on the front panel is the 20 km path.
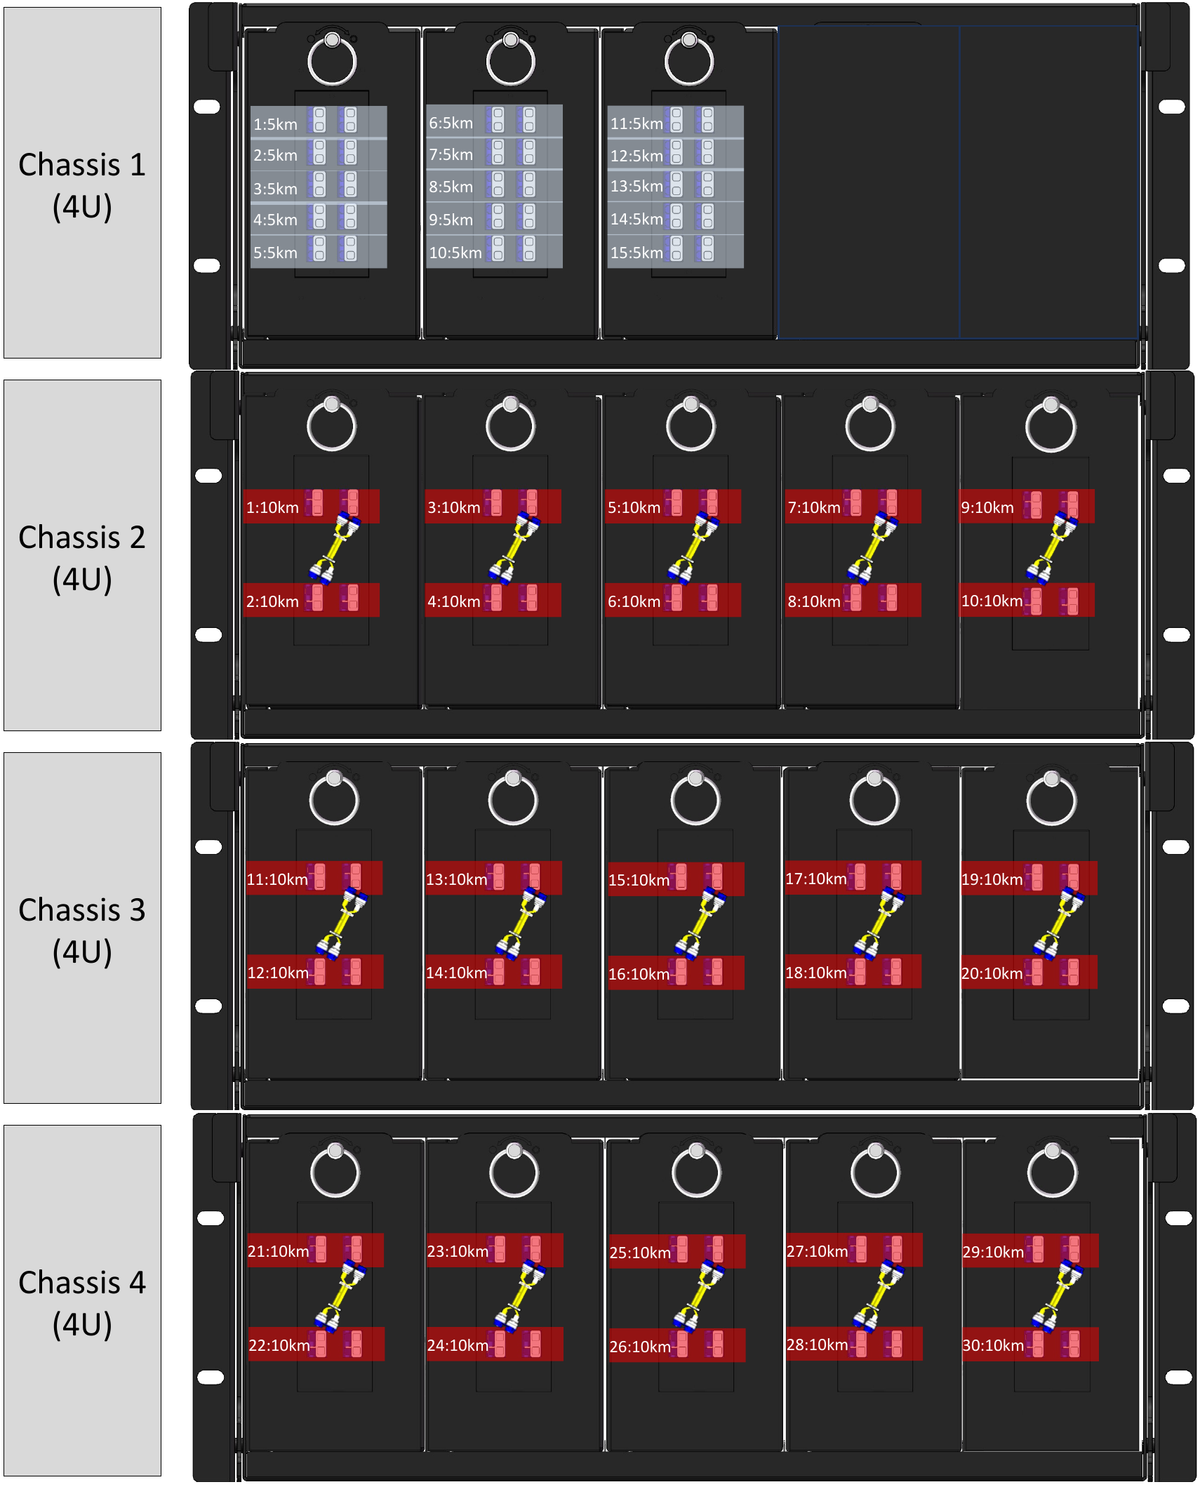
5 km (2 mated connections)
10 km (2 mated connections)
20 km (4 mated connections)
Rack planning
Allow room in front of the chassis for test cords and jumpers, and label both ends of every cord with the link and path it serves. Every change of distance happens on the front panel, so nothing behind the chassis is touched once it is installed.
05Expected insertion loss at 5, 10 and 20 km
Insertion loss is the fiber loss plus the loss of each mated connection. The table uses planning values of 0.34 dB per km at 1310 nm, 0.20 dB per km at 1550 nm and 0.15 dB per LC/UPC connection. The worst case uses the spool fiber's limits, 0.35 and 0.20 dB per km, and 0.30 dB per connection.
| Path | Connections | 1310 nm planning (dB) | 1310 nm worst case (dB) | 1550 nm planning (dB) | 1550 nm worst case (dB) |
|---|---|---|---|---|---|
| 5 km | 2 | 2.0 | 2.4 | 1.3 | 1.6 |
| 10 km | 2 | 3.7 | 4.1 | 2.3 | 2.6 |
| 20 km (two 10 km spools and a jumper) | 4 | 7.4 | 8.2 | 4.6 | 5.2 |
Fiber is most of the loss on every path, and 1310 nm loses more than 1550 nm. The 20 km jumper adds about 0.3 dB. These are estimates for planning; the factory report replaces them with a measured value for each path, which is usually lower than the worst case.
06Check the paths against your optics
Compare each path with the channel insertion loss your optics allow. A 10 km-class optic such as 100G or 400G LR4 allows 6.3 dB.
| Path | 1310 nm loss (dB) | Within a 6.3 dB budget? |
|---|---|---|
| 5 km | 2.0 to 2.4 | Yes |
| 10 km | 3.7 to 4.1 | Yes |
| 20 km | 7.4 to 8.2 | No: use optics rated for 20 km or more |
Check the other end of the budget too. Some long-reach optics need a minimum loss to avoid overloading the receiver, and a passive 5 km path may not provide it. If so, the test plan needs a separate attenuator for those optics, or a longer path. More on loss budgets and connections in our link flapping guide.
07Factory test reports for a distance simulator
A distance simulator is test equipment, so its own numbers need to be known. Ask for these with every system, matched to the path labels on the front panel:
| Report | What it shows | Why it matters |
|---|---|---|
| Insertion loss | Measured loss of each path at 1310 and 1550 nm | The real value to use in your test results, instead of an estimate |
| Return loss | Light reflected back at each path | UPC connections commonly reach 50 dB or better; low return loss points to a dirty or damaged end face |
| Bidirectional OTDR, 1310 and 1550 nm | A trace from each end of every fiber, at both wavelengths | Shows every connection and splice along the spool. Averaging both directions removes false gains and losses at splices, and 1550 nm shows bending in the winding |
| End-face inspection | An image of every connector end face | Proves the connectors left the factory clean and undamaged |
| Measured length | The actual length of each spool | A 10 km spool is not exactly 10.000 km; the real length is what sets delay |
| Fiber attenuation | Loss per km of each spool | Confirms the fiber meets its datasheet |
Store the reports with the system. When a test result looks wrong later, a new OTDR trace compared with the factory trace shows at once whether the simulator has changed.
08Start with a prototype
For a large system, build one full-duplex path at each distance first. In design B that is one 5 km cassette, of which the prototype needs one path, and one 10 km cassette, which gives both 10 km and 20 km. Use it to:
- Confirm the measured loss against the planning values
- Bring up links with the actual optics at each distance, including the 20 km jumper
- Check the labels, front-panel layout and test reports before ordering the full set
The prototype uses the same cassette types as the full system, so it can stay in service when the rest arrives.
09Expansion
- More links: add cassettes in the open slots, or add chassis
- Longer distances: Fiber-in-a-Box cassettes come in 10, 15, 20 and 25 km lengths, and the 6U chassis holds 6 or 8 spools of up to 25 km each
- Other connectors: LC, SC, ST, FC or MPO, depending on the system
- Longer chains: join paths on the front panel, adding about 0.3 dB for each jumper
10Frequently asked questions
What is a fiber distance simulator?
Spools of real single-mode fiber in a rack-mounted enclosure, with connectors on the front panel. It puts kilometers of fiber on the bench, so optics, links and protocols can be tested over real distance without a field run.
Why use spooled fiber instead of an optical attenuator?
An attenuator copies the loss of a long link but not its length. Spooled fiber also adds the delay and chromatic dispersion of the real distance, about 4.9 microseconds per kilometer each way. Use an attenuator for receiver sensitivity tests and spooled fiber when timing or dispersion matters.
How much insertion loss does a 10 km test path have?
About 3.7 dB at 1310 nm and 2.3 dB at 1550 nm, counting the fiber and the two front-panel connections. The worst case is about 4.1 dB and 2.6 dB. The factory report gives the measured value for each path.
How do you make a 20 km path from 10 km spools?
Join two 10 km spools with a short duplex LC patch cord on the front panel. The patch cord adds two mated connections, about 0.3 dB and at most 0.6 dB. Remove it to go back to 10 km.
Can every link run at 5, 10 and 20 km at the same time?
Not in the shared-spool design. Each link has its own 5 km path and a pair of 10 km spools, so it can run 5 km plus either 10 km or 20 km at once. Running all three at once needs a separate 20 km path, which adds fiber.
Which test reports should ship with a distance simulator?
Insertion loss and return loss for each path, bidirectional OTDR traces at 1310 and 1550 nm, end-face inspection images, the measured length of each spool and the fiber attenuation in dB per km, all matched to the path labels.
How much rack space does a 15-link 5, 10 and 20 km simulator need?
Four 4U chassis, 16U in total: one chassis with three 5 km cassettes and two open slots, and three chassis of 10 km cassettes for the 10 and 20 km paths.
Planning a test bed? Send us the links and distances and we will return a layout and the expected loss for each path, or see the Fiber-in-a-Box datasheets.
11Sources
- Fiber-in-a-Box datasheet: spool fiber attenuation (under 0.35 dB/km at 1310 nm, under 0.20 dB/km at 1550 nm) and chromatic dispersion (under 18 ps/(nm·km) at 1550 nm)
- 4U Fiber-in-a-Box with modular slots datasheet: five cassettes per 4U chassis, cassette lengths and connector options
- IEEE 802.3: channel insertion loss of 6.3 dB for 100GBASE-LR4 and 400GBASE-LR4-6
- Planning values for fiber and connection loss: Wave2Wave engineering. Connection counts and loss budgets by optic are covered in more depth in our link flapping guide.
Need a distance simulator for your lab?
Send the number of links, the distances and the connectors you need. We reply within 24 hours with a layout and expected loss for each path.